

The Option Chain: Navigating the Dashboard of Market Uncertainty
If you are staring at a BTC ticker and thinking you’ve seen the "market," you are looking at a single point in a multi-dimensional storm. For a professional trader on OrderX, the price is just the starting point. The real information—the liquidity, the fear, and the structural commitment—lives in the Option Chain.
Most retail gamblers treat the chain like a betting slip, hunting for the cheapest premium. A risk-aware trader treats it like a radar system. If you don't know how to interpret the data between the columns, you aren't trading; you're just a passenger.
The Anatomy of the Chain: Calls vs. Puts
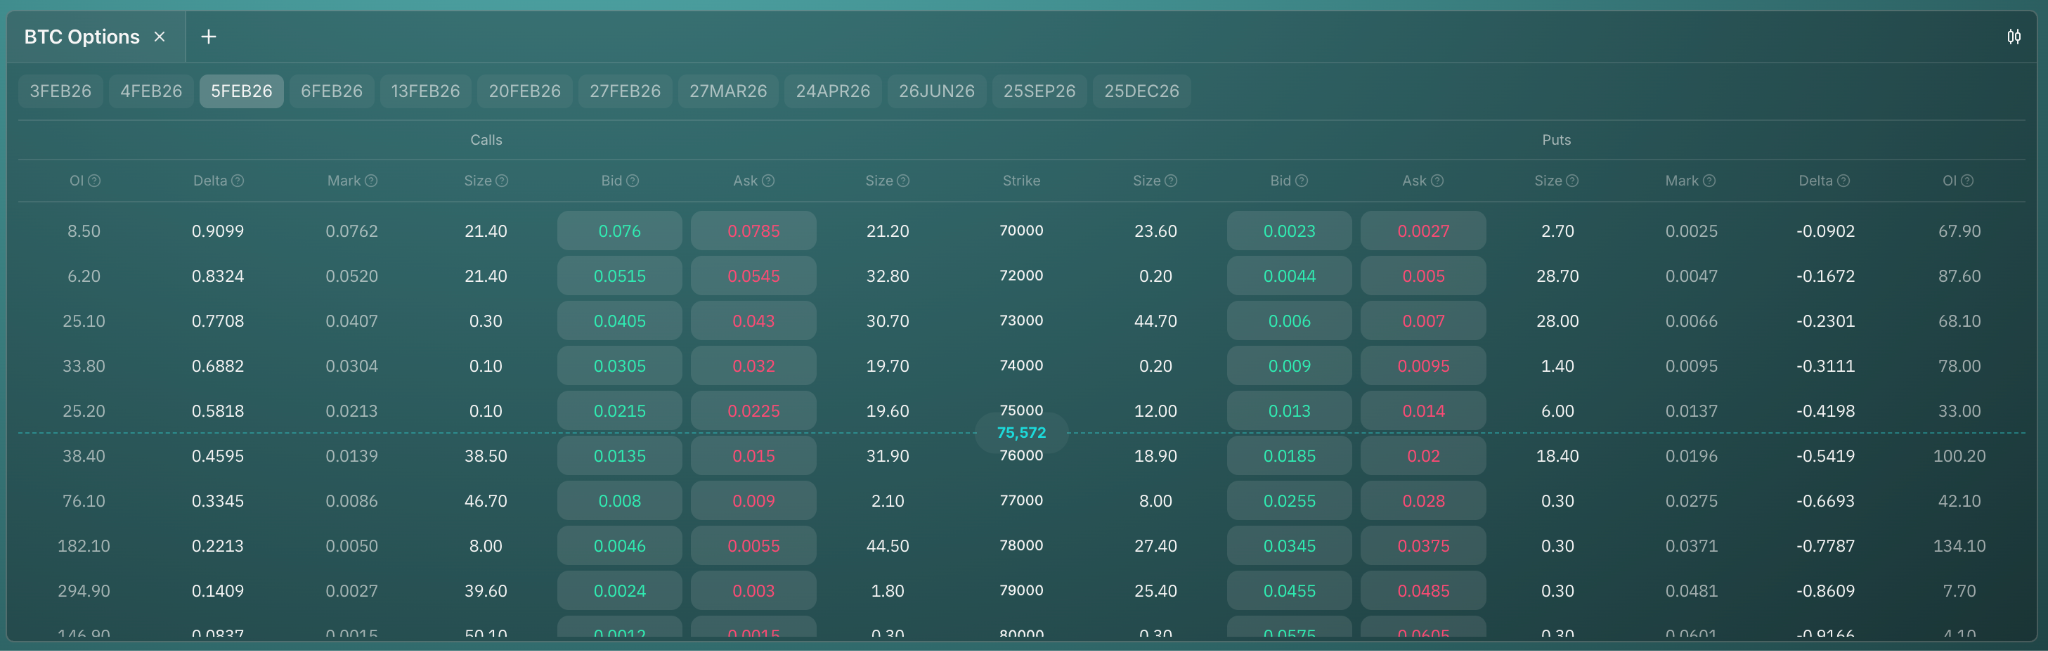
The option chain is a standardized matrix. On OrderX, the layout is clinical: Calls on the left, Puts on the right, and the Strike Price 𝑲 acting as the central axis.
- The Mid-Point (The Strike): This is the "choice." It is the only fixed variable you can control. Everything else on the chain is fluid, dictated by the market's collective assessment of probability.
- The Mirror Effect: For every strike, there is a Call and a Put. One prices the "right to buy," the other prices the "right to sell." Professionals don't just look at one side; they look at the Skews—why is a Put more expensive than a Call at the same distance from spot? (Spoiler: It’s usually because the market is terrified of a dump).
The "Sensors": Beyond the Premium
The "Price" column is the least interesting part of the chain. To understand the OrderX environment, you must look at the secondary data:
1. Bid/Ask Spreads (The Liquidity Tax)
If the gap between the Bid and Ask is wide, you are looking at an illiquid market. Every time you cross that spread, you are paying an immediate "friction tax."
- The Provocation: If you are "market buying" OTM options with wide spreads, you are essentially starting your trade with a 10% loss. Professionals wait for liquidity or use limit orders to avoid being exploited by the spread.
2. Volume vs. Open Interest (Noise vs. Commitment)
- Volume: How many contracts were traded today. This is the "noise" of current activity.
- Open Interest (OI): How many contracts are currently active and held by market participants. This is the structural commitment. High OI at a specific strike acts as a "magnetic" level—a pivot point where market makers may need to aggressively hedge their positions.
3. Implied Volatility (IV): The Uncertainty Index
This column tells you how much the market is charging you for the possibility of chaos.
- Calculated Risk: When IV is high, premiums are fat. When IV is low, premiums are cheap. If you aren't comparing the current IV to the Historical Volatility (HV), you are likely overpaying for your "insurance."
The Transition: From Layout to Logic
Reading the chain is just the first step. You now see the strikes, the prices, and the participation. But to actually trade these contracts, you need to understand the forces that move them in real-time.
The option chain shows you the Static State of the market. The Greeks show you the Dynamic Risk.
- Delta 𝚫: How much your position earns for every $1 BTC move.
- Gamma 𝚪: How fast your Delta changes as BTC accelerates.
- Theta 𝜭ᶿ: The rate at which the clock is killing your premium.
- Vega 𝐕: How much your position is worth as the "market weather" (IV) shifts.
Conclusion: Stop Guessing, Start Monitoring
The OrderX option chain is not a menu; it is a data set. If you are picking strikes based on a "feeling," you will be mathematically outperformed by those who pick strikes based on Delta-neutrality or Gamma-scalping.
In our next series, we will peel back the surface of the chain and dive into The Greeks. We will show you how to measure your risk, how to hedge your exposure, and how to stop being the one who pays the premium and start being the one who collects it.